Question: What is the relationship between the position of a buggy car and the time it is running?
Independent Variable: Time (seconds)
Dependent Variable: Position (centimeters)
Control Variables: Type of buggy, riding track, and starting height
Collection Method:
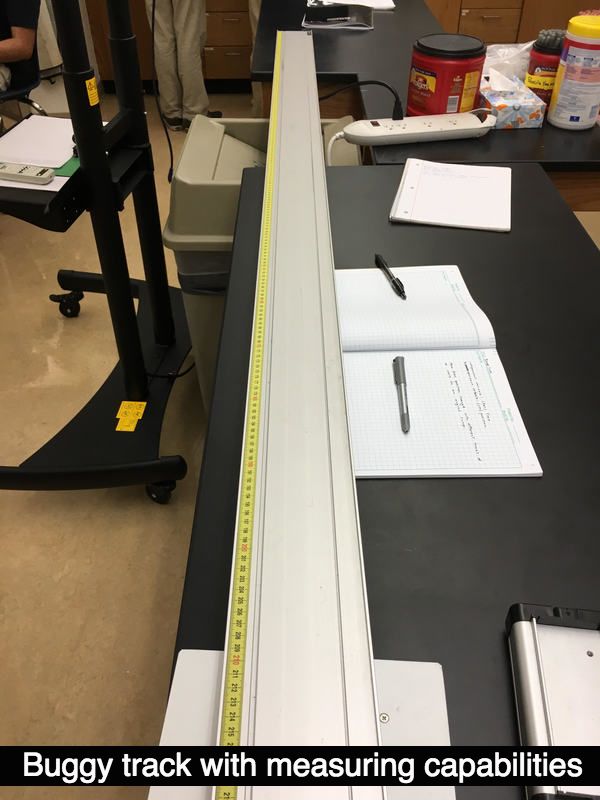
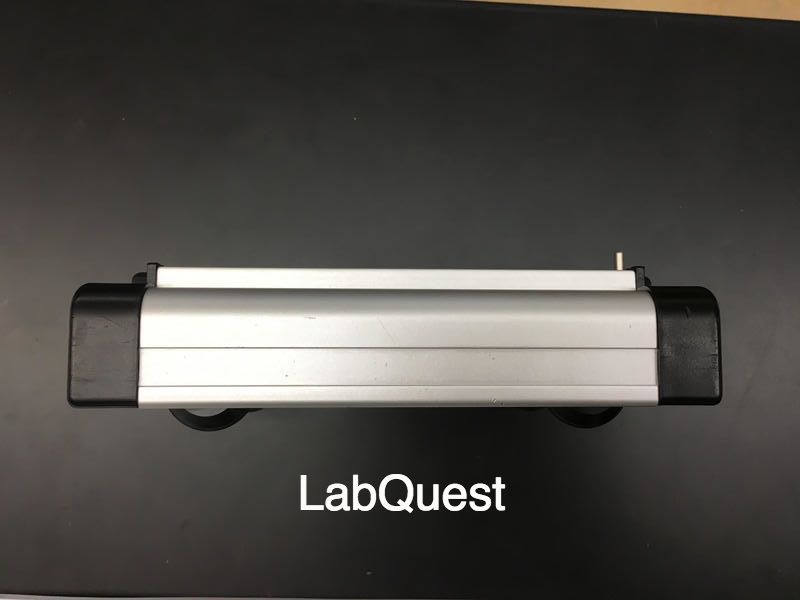
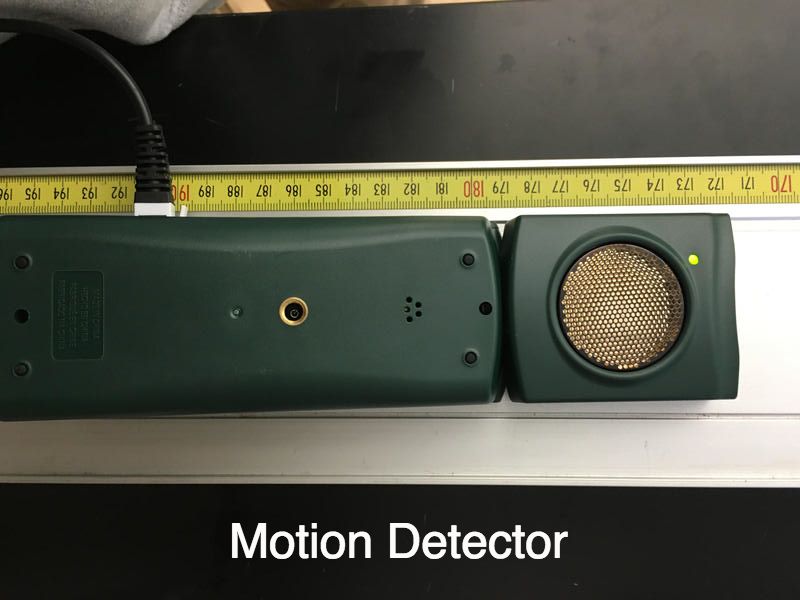
In order to determine the position of a buggy car at a certain time, we have to start our buggy at a specific initial point and let it run until the time interval is up. In order to provide us with a substantial amount of data we can use eleven different intervals at 0, 0.5 1, 1.5, 2, 2.5, 3, 3.5, 4, 4.5, and 5 seconds. To record our time we will be using three different methods, a stopwatch, motion sensor, and a video analysis program. In addition to these collection devices, we will be using a large metal meter stick that measures up to approximately 230 centimeters and a labquest to store and transfer data. Once we have collected all the necessary materials, we will place our buggy at an initial position starting from the front of the front wheel; this point will act as our y-intercept for our data. After this, we will use our different methods of time recording to test the position over different intervals.
Independent Variable: Time (seconds)
Dependent Variable: Position (centimeters)
Control Variables: Type of buggy, riding track, and starting height
Collection Method:
In order to determine the position of a buggy car at a certain time, we have to start our buggy at a specific initial point and let it run until the time interval is up. In order to provide us with a substantial amount of data we can use eleven different intervals at 0, 0.5 1, 1.5, 2, 2.5, 3, 3.5, 4, 4.5, and 5 seconds. To record our time we will be using three different methods, a stopwatch, motion sensor, and a video analysis program. In addition to these collection devices, we will be using a large metal meter stick that measures up to approximately 230 centimeters and a labquest to store and transfer data. Once we have collected all the necessary materials, we will place our buggy at an initial position starting from the front of the front wheel; this point will act as our y-intercept for our data. After this, we will use our different methods of time recording to test the position over different intervals.
|
Procedures:
Setup: The video on the right shows the way the experiment was set up. This specific video highlights the video analysis trial of the experiment, but for the motion detector trial we had a motion detector added to the right side of the beam, and for the stopwatch trial, we had someone timing to the best of their ability. |
Experiment Setup
| ||||
Recorded Raw Data:
Stopwatch Data:
Time (seconds) |
Position (centimeters) |
17 |
|
0.5 |
25 ± 1 |
1 |
35 ± 1 |
1.5 |
49 ± 1 |
2 |
56 ± 1 |
2.5 |
67 ± 1 |
3 |
75 ± 1 |
3.5 |
87 ± 1 |
4 |
92 ± 1 |
4.5 |
105 ± 1 |
5 |
114 ± 1 |
Both the motion detector and video analysis data were recorded in LoggerPro and were not able to be transferred, but will be displayed in the Processed Data section in graphs.
Processed Raw Data:
No equations were needed in order to process data. The data in the stopwatch trial was directly transferred into a graph that will be displayed in the next section. The other two trials were plugged into LoggerPro and gave us graphs that will also be analyzed in the next section.
No equations were needed in order to process data. The data in the stopwatch trial was directly transferred into a graph that will be displayed in the next section. The other two trials were plugged into LoggerPro and gave us graphs that will also be analyzed in the next section.
Presentation of Processed Data:
The following graph is of the first trial, the stopwatch. It represents the relationships between time (sec) and position (cm). The graph itself has 11 different data points that range from (0,17) to (5,114). Because the data was taken down using a stopwatch there was uncertainty due to reaction time. We were not able to precisely record the times and positions of the buggy, but we were able to approximate the position within 1 cm to the recorded data, which can be seen in the graph.
The following graph is of the first trial, the stopwatch. It represents the relationships between time (sec) and position (cm). The graph itself has 11 different data points that range from (0,17) to (5,114). Because the data was taken down using a stopwatch there was uncertainty due to reaction time. We were not able to precisely record the times and positions of the buggy, but we were able to approximate the position within 1 cm to the recorded data, which can be seen in the graph.
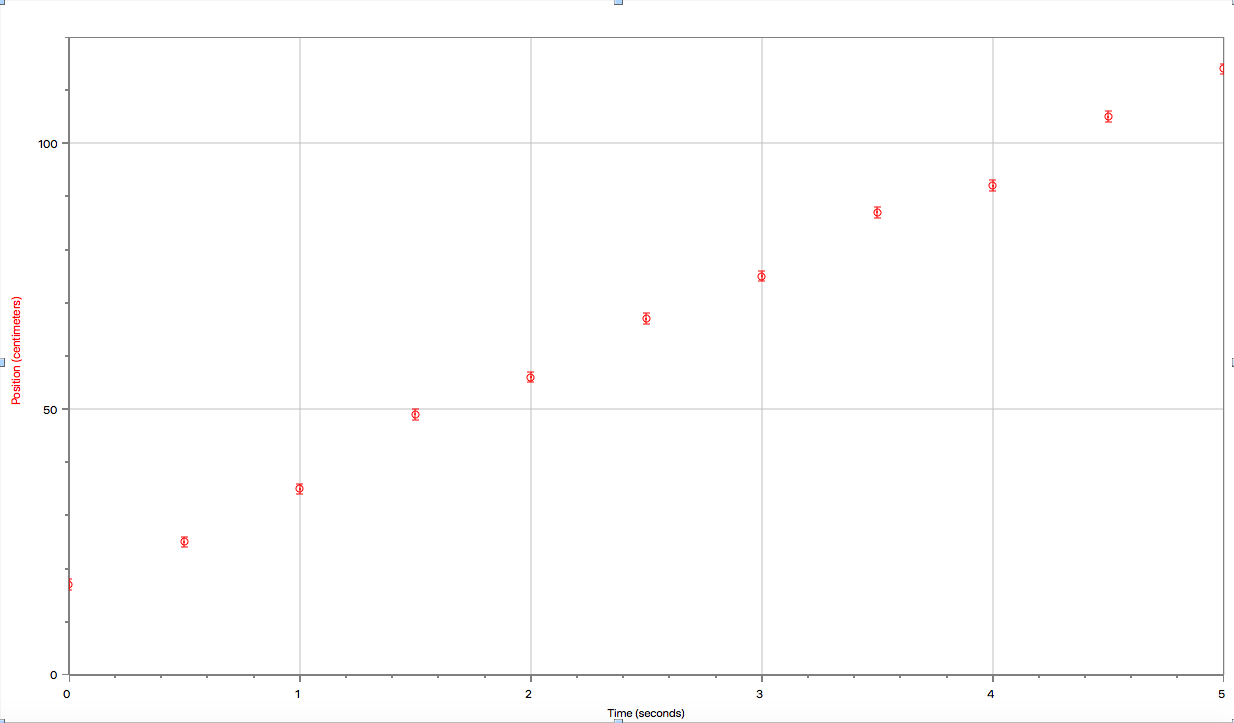
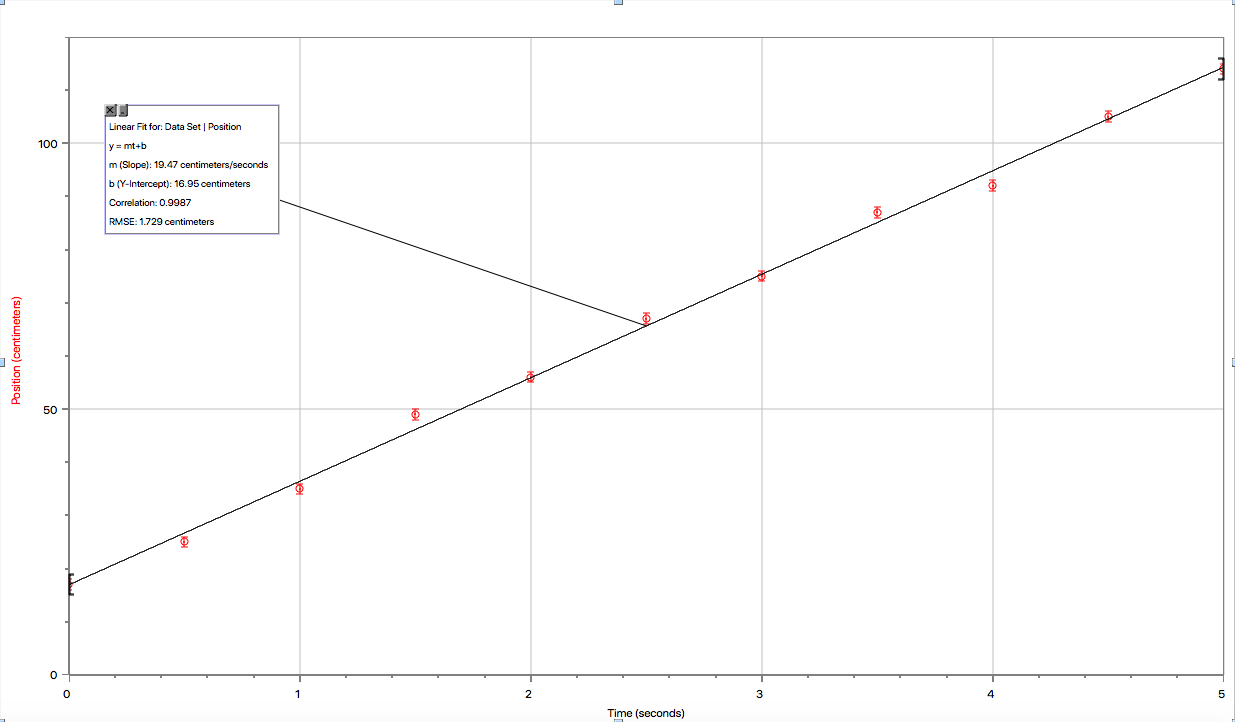
The next graph includes the same data as the first but additionally has the line of best fit connecting the data points. From the line correlation and minimal error from the data points, we can infer a relatively linear relationship between our data.
Line of Best Fit Equation: Position of Buggy (cm) = 19.47 (cm/sec) * t (sec) + 16.95 (cm)
The y-intercept of our graph is approximately 17 centimeters, which represents the starting position of the buggy at time 0.
Line of Best Fit Equation: Position of Buggy (cm) = 19.47 (cm/sec) * t (sec) + 16.95 (cm)
The y-intercept of our graph is approximately 17 centimeters, which represents the starting position of the buggy at time 0.
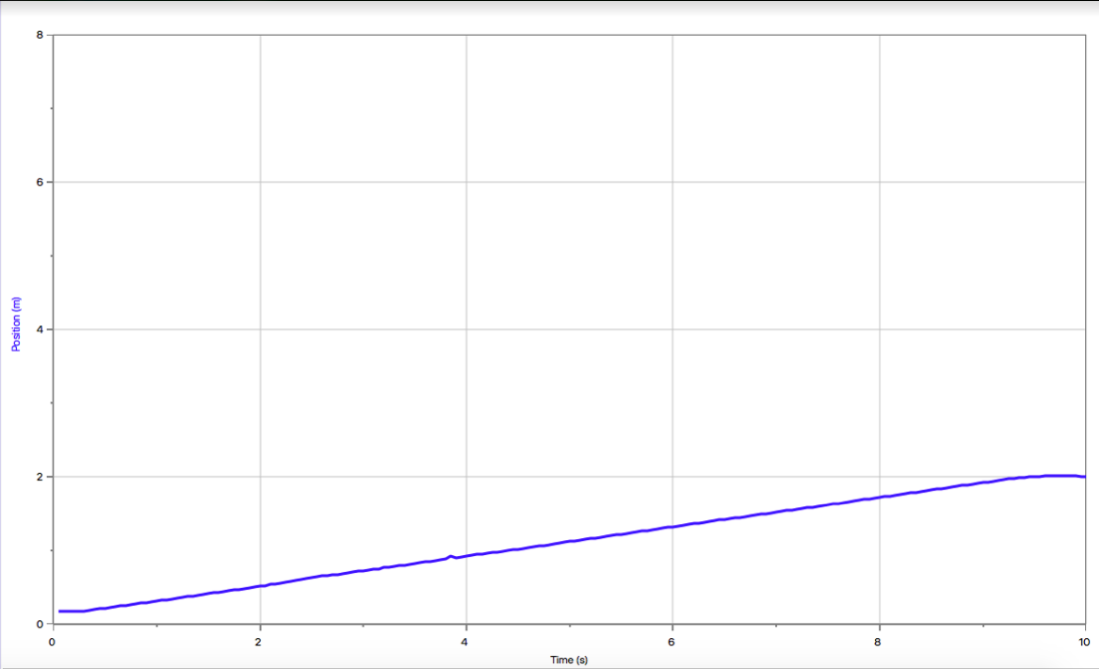
The next graph collects data points utilizing a motion detector and represents the relationship between time (seconds) and position (meters). There are thousands of points on the graph meaning that they naturally form a line. There is not much uncertainty between these points, since there are so many of them that a slight uncertainty would not affect the data, and that it is a technological simulation which will have less room for an error due to being coded.
Line of Best Fit Equation: Position of Buggy (cm) = 19.95(cm/sec) * t (sec) + 11.83 (cm)
The y-intercept of our graph is approximately 11.83 centimeters, which represents the starting position of the buggy at time 0.
Line of Best Fit Equation: Position of Buggy (cm) = 19.95(cm/sec) * t (sec) + 11.83 (cm)
The y-intercept of our graph is approximately 11.83 centimeters, which represents the starting position of the buggy at time 0.
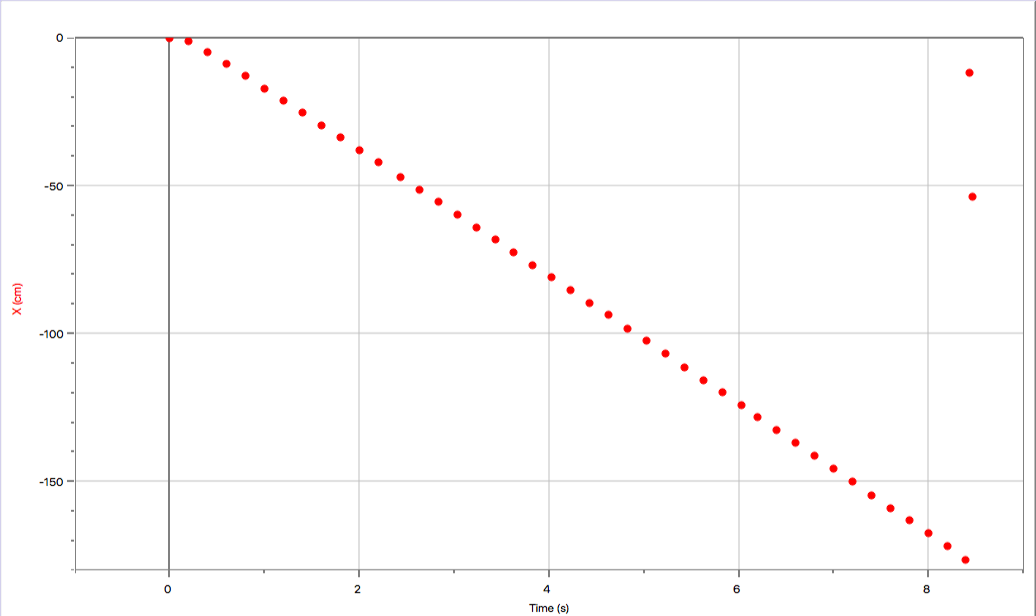
The next graph collects data points utilizing video analysis and represents the relationship between time (seconds) and position (centimeters). There are approximately 45 data points recorded, however two of which are outliers that could have been caused by the buggy exiting the frame while the time was still going. Theoretically speaking, video analysis would probably have the least amount of uncertainty, however, because of the low quality of the some of the videos and the not precise points being placed, the video analysis results may have been tampered with or skewed. Additionally, due to the nature of the video analysis software and the way the video was recorded, our numbers were inverted from positive to negative.
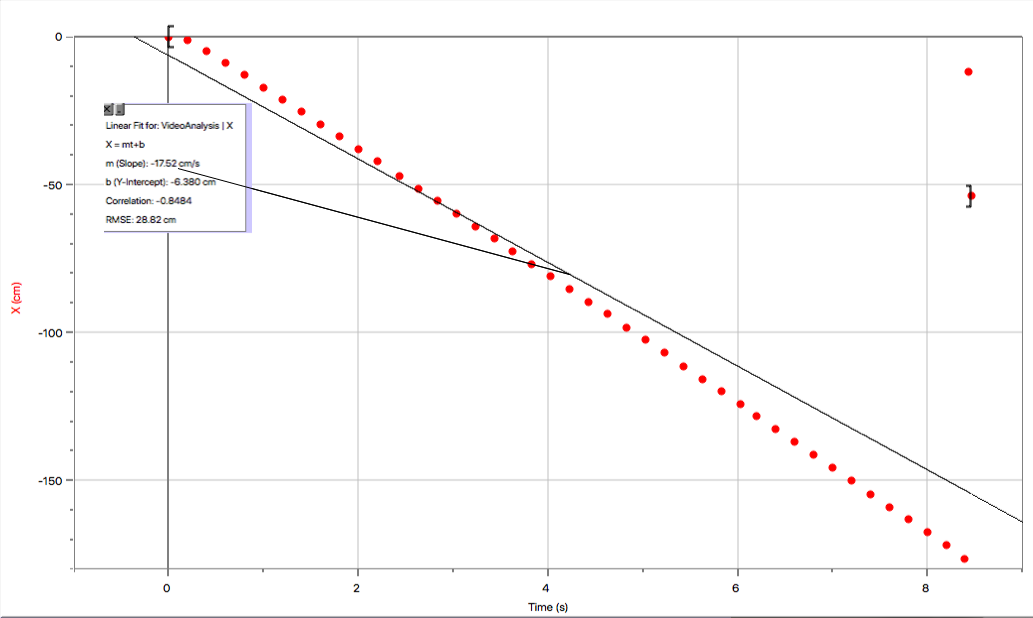
The last graph includes the same data as the previous but additionally has the line of best fit connecting the data points. From the line correlation and error we can still conclude the correlation is more than likely linear.
Line of Best Fit Equation: Position of Buggy (cm) = -17.52 (cm/sec) * t (sec) - 6.380 (cm)
Line of Best Fit Equation (with positive numbers): Position of Buggy (cm) = 17.52 (cm/sec) * t (sec) + 6.380 (cm)
The y-intercept of our graph is approximately -6.380 centimeters, which represents the starting position of the buggy at time 0.
Conclusion:
Throughout all three of the trials we were testing the relationship between time (seconds) and position (centimeters/meters). According to our data we can see a basic linear correlation between our two variables, although our last set of data may have been negative, if the video analysis had been flipped we would have also gotten a positive linear correlation between our two variables. Because of this correlation we know that the more time that passes is theoretically directly proportional to the position of a buggy. One issue that presented itself when concluding our results however was the uncertainty, we had varying uncertainty with minimal during the motion detector trial. Because of this uncertainty we are not able to settle on a definite equation that represents the linear correlation between our two variables.
Evaluation Procedures:
During our first trial we noticed that we were not able to get exact measurements causing us to have an uncertainty of 1. Because there is reaction time between a stopwatch actually hitting 1 second and someone stopping the buggy, we could not get the precise data and therefore our procedures could be slightly flawed. During the motion detector trial we noticed little error do to the motion detector picking up a steady rate of movement throughout the entirety of the trial. However during the video analysis, we changed back to larger uncertainty due to the video analyzing program not being able to fully encompass all of the data points. In addition to all of these, our measuring stick and track was not always flat on the table and could have possibly increased velocity or acceleration during our experiment skewing our results.
Improving the Investigation:
To do so, obtaining better video equipment and analyzing programs that can break down the data to the frame so we can get more data points and try to find a more correlating linear regression. Completely removing the stopwatch portion of the experiment would be beneficial, because the results will never be precise due to reaction time. Lastly, adding more trials to the motion detector, the motion detector proved to be the best source of data from all three trials, replacing the stopwatch trial with the motion detector, or even adding a separate other motion detector trial would be beneficial the experiment and raise confidence.
