Scientific and Mathematical Models:
Representation of an idea
Success is measured in accuracy
Design:
Defining problem and selecting variable
Controlling variables
Developing method for collection data
Data collection and processing:
Recording raw data
Processing data
Representation of an idea
Success is measured in accuracy
Design:
Defining problem and selecting variable
Controlling variables
Developing method for collection data
Data collection and processing:
Recording raw data
Processing data
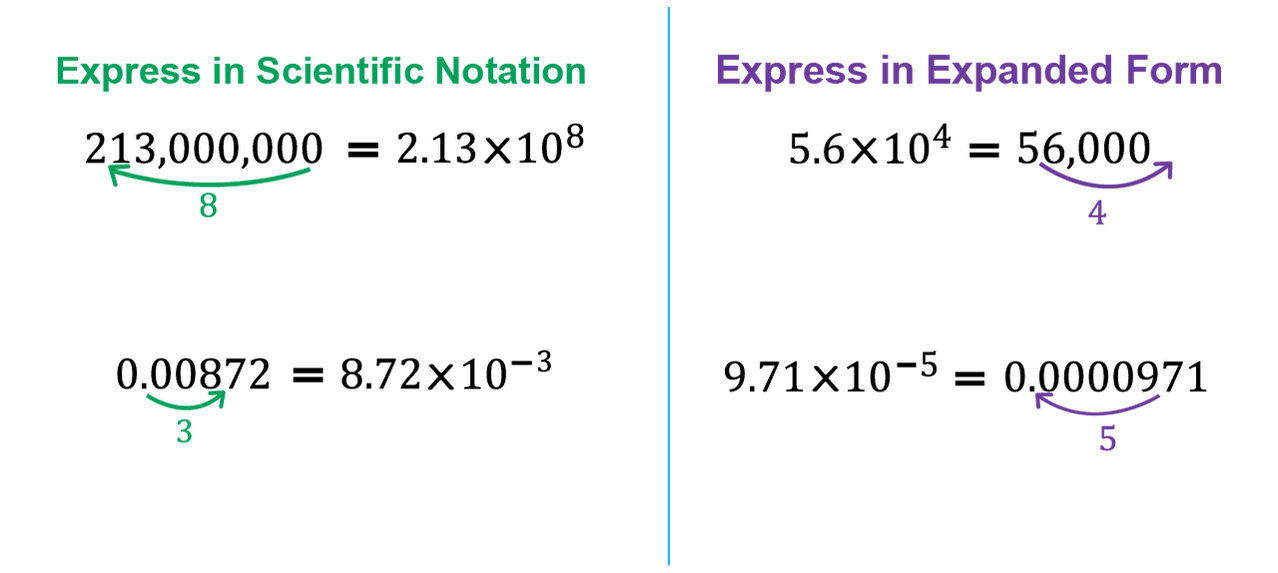
Scientific Notation:
The symbol "E" (EE on the calculator) represents x10^(power). Scientists don't use "E", they only use x10^(power), so refrain from using it.
When expressing scientific notation, you count from where the current decimal point either to the right or left to achieve a value less than 10.
The symbol "E" (EE on the calculator) represents x10^(power). Scientists don't use "E", they only use x10^(power), so refrain from using it.
When expressing scientific notation, you count from where the current decimal point either to the right or left to achieve a value less than 10.
Unit Conversions:
Using dimensional analysis is extremely important while trying to convert units.
Use the following steps to use dimensional analysis correctly:
1. Enter your value WITH UNITS on the top.
2. Find the conversion on your table that is necessary and write a fraction that is equivalent to one.
3. Repeat step 2 as many times necessary until you are able to reach your goal unit (MAKE SURE TO BE USING UNITS THE ENTIRE WAY THROUGH)
Example:
Linear Mathematical Models:
Slope - Steepness of your line, rise over run.
Y-intercept - The point on the y-axis where the x value equals 0.
Improving your investigations:
More points, better range = better data
Re-test your outliers
1. Lots of data (5-10 points)
2. Large Range (10x the smallest)
3. Multiple trials (3-5)
Sources of Uncertainty:
Reaction time - As humans we can't get the exact precise measurements of when an experiment should be stopped with a timer
Parallax shift
Equipment - Sometimes we don't have the highest quality equipment and we can't get the best results
