Question: What is the relationship between mass added to a spring and the length of a spring?
Independent Variable: Mass (grams)
Dependent Variable: Amount spring stretched (centimeters)
Control Variables: Type of spring, length of spring, and elasticity of spring
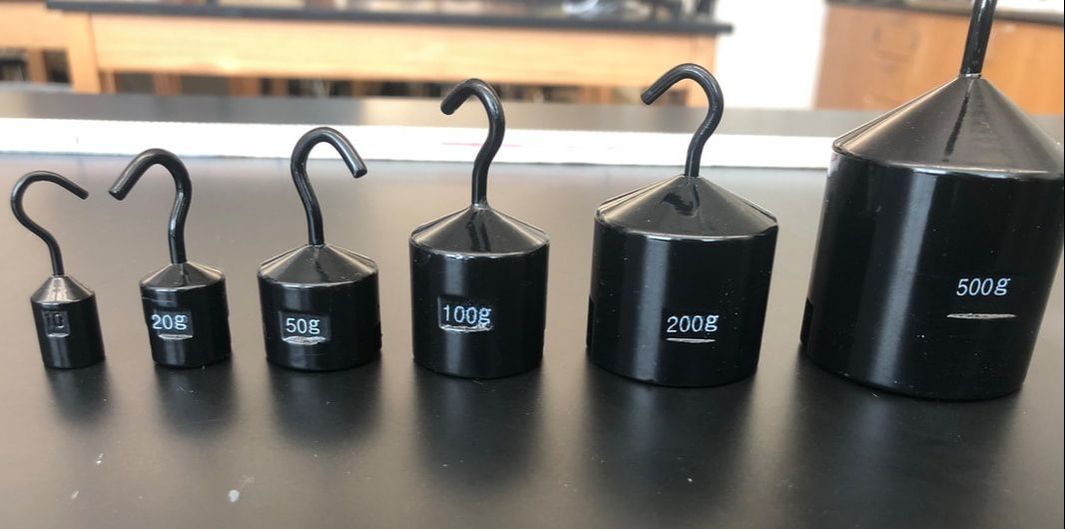
Collection Method: In order to determine the amount a spring will be stretched, we have to find the difference between a spring before and after mass is added. Gathering and testing weights and combinations of masses of 10, 20, 50, 100, 200, and 500 grams, will be able to provide us with a substantial range of data to interpret and deduce accurate conclusions. In addition to these weights, one constant spring, hook, and stand will be used throughout our experiment to keep consistency and prevent skewing of data. Once we have all of the necessary materials, we will measure the initial length of our spring in centimeters, add our weights and combinations, measure the current length of our spring, and then subtract the two to find the difference.
Independent Variable: Mass (grams)
Dependent Variable: Amount spring stretched (centimeters)
Control Variables: Type of spring, length of spring, and elasticity of spring
Collection Method: In order to determine the amount a spring will be stretched, we have to find the difference between a spring before and after mass is added. Gathering and testing weights and combinations of masses of 10, 20, 50, 100, 200, and 500 grams, will be able to provide us with a substantial range of data to interpret and deduce accurate conclusions. In addition to these weights, one constant spring, hook, and stand will be used throughout our experiment to keep consistency and prevent skewing of data. Once we have all of the necessary materials, we will measure the initial length of our spring in centimeters, add our weights and combinations, measure the current length of our spring, and then subtract the two to find the difference.
|
Procedures:
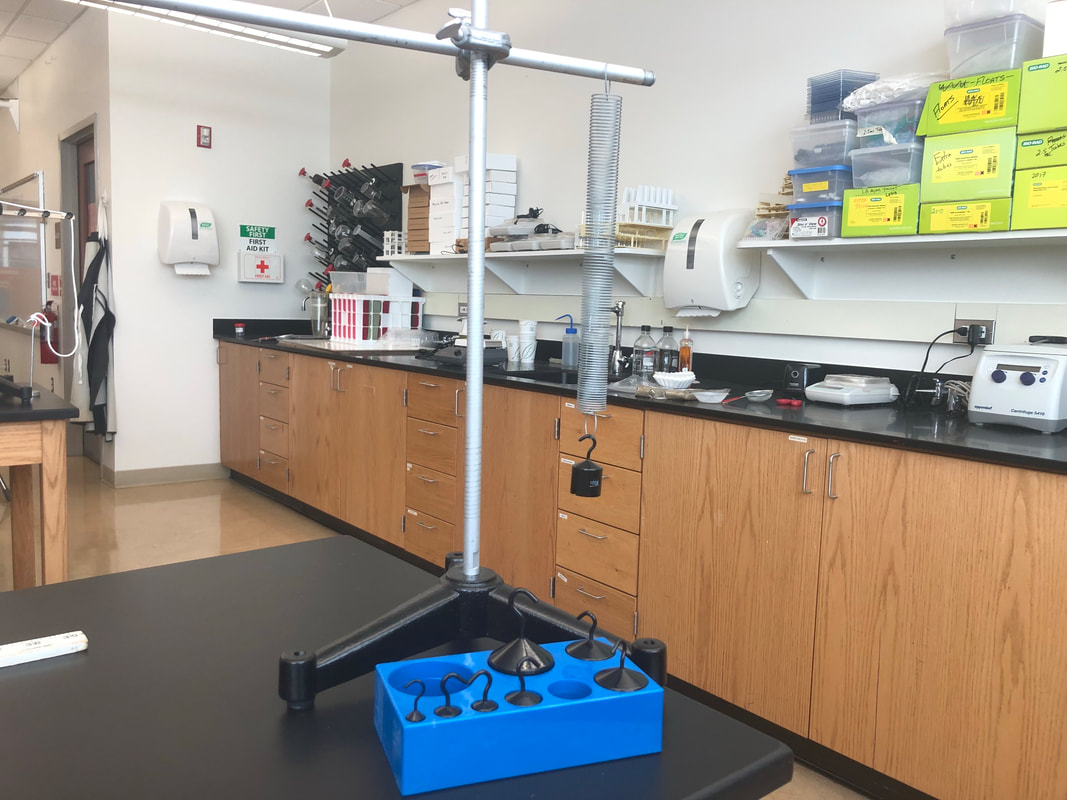
Setup: The picture on the right is a photograph of the setup used for the experiment. The stand used for the spring consists of a stand (black), with a metal rod screwed into it. Onto that metal rod is a clamp that attaches another rod which allows the spring to hang onto. The spring has two hoops that are bent on the top and bottom of it. The top being used for being hung on the stand, and the bottom being used for hooking weights on. |
|
Recorded Raw Data:
Mass (g) |
Original Spring Length (cm) |
End Spring Length (cm) |
10 |
12 |
13 |
20 |
12 |
14.25 |
50 |
12 |
18.5 |
100 |
12 |
25.5 |
200 |
12 |
39 |
300 |
12 |
53 |
400 |
12 |
66.5 |
500 |
12 |
80 |
800 |
12 |
122 |
Processed Raw Data:
The only needed calculations to help solve our question is finding the difference between the original and end spring length. In order to do this, we just subtract the two values using the following equation.
Difference in Spring Length (cm) = End Spring Length (cm) - Original Spring Length (cm)
The only needed calculations to help solve our question is finding the difference between the original and end spring length. In order to do this, we just subtract the two values using the following equation.
Difference in Spring Length (cm) = End Spring Length (cm) - Original Spring Length (cm)
Mass (g) |
Original Spring Length (cm) |
End Spring Length (cm) |
Difference in Spring Length (cm) |
10 |
12 |
13 |
1 |
20 |
12 |
14.25 |
2.25 |
50 |
12 |
18.5 |
6.5 |
100 |
12 |
25.5 |
13.5 |
200 |
12 |
39 |
27 |
300 |
12 |
53 |
41 |
400 |
12 |
66.5 |
54.5 |
500 |
12 |
80 |
68 |
800 |
12 |
122 |
110 |
Presentation of Processed Data:
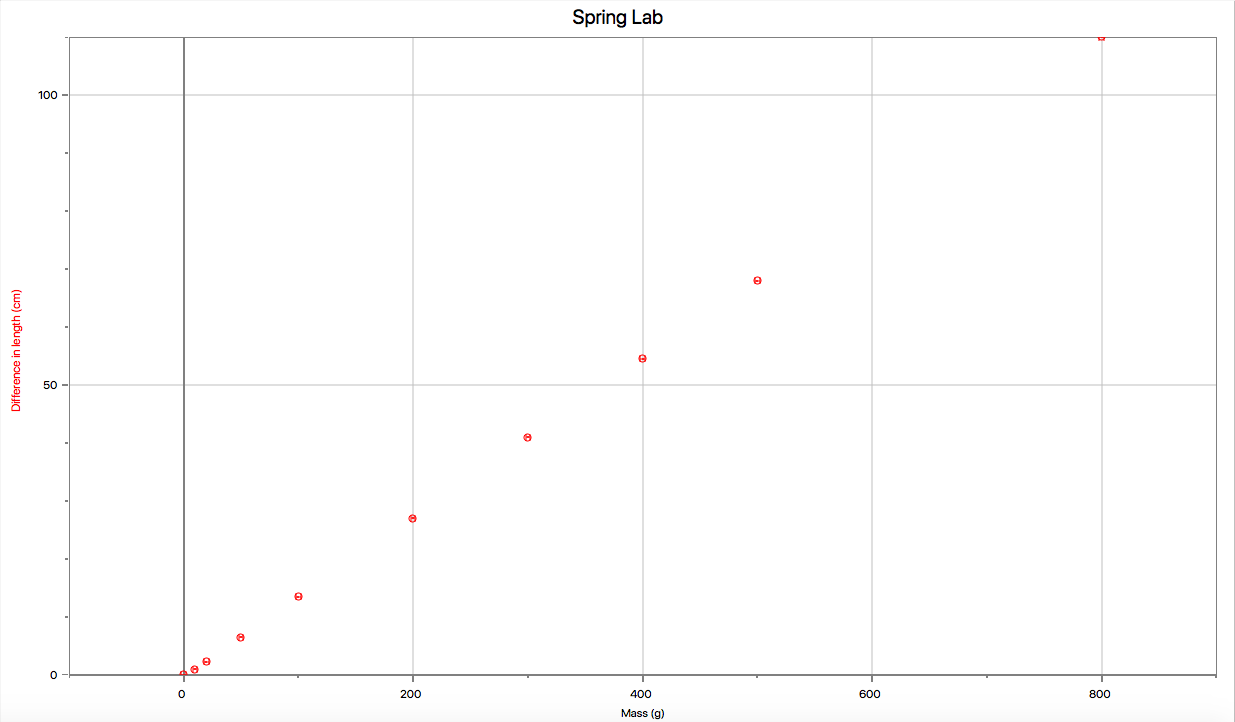
The following graph represents the relationship between the Mass (g) and the Difference in length of the spring (cm). It includes 10 different data values (the point (0,0) has been added).
The following graph represents the relationship between the Mass (g) and the Difference in length of the spring (cm). It includes 10 different data values (the point (0,0) has been added).
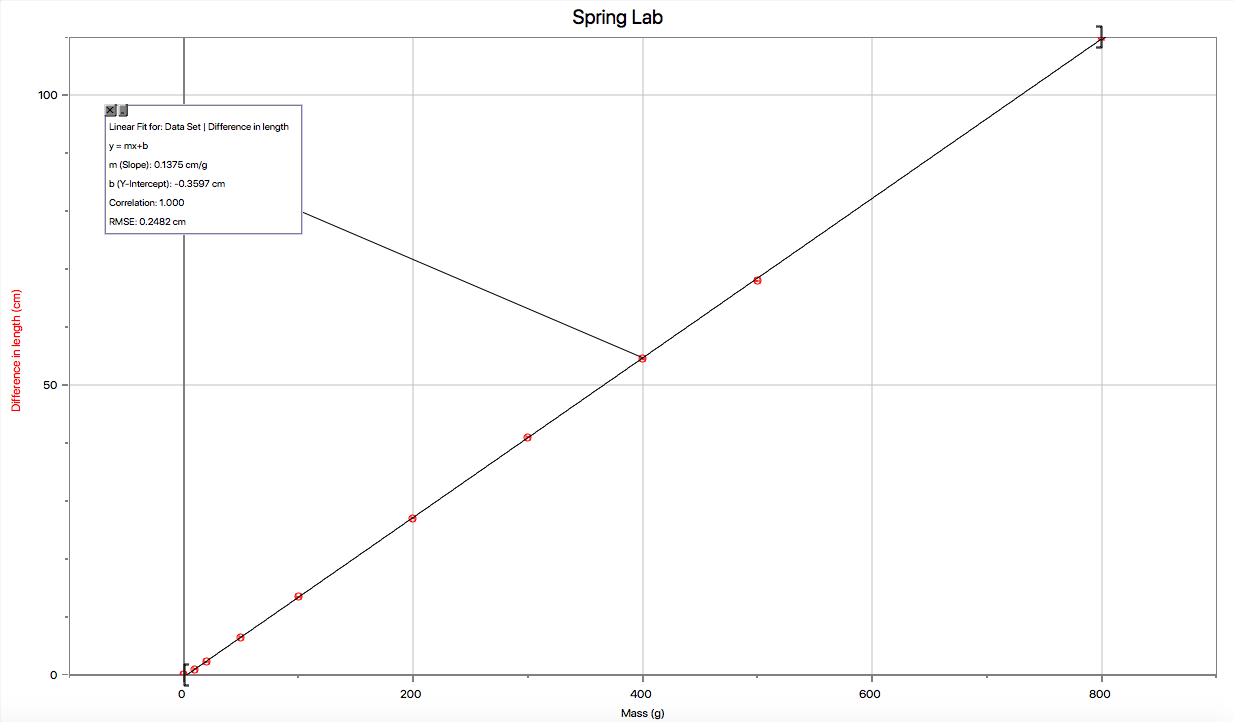
The next graph includes the same data as the first but additionally has the line of best fit connected the data points. From the line correlation and minimal error from the data points, we can infer a relatively linear relationship between our data. However, the last point on the graph is (800, 110), which was the highest mass that was able to be tested due to the constraints of the height available between the stand and floor. If our experiment could have continued beyond 800g, we may have seen fluctuation between the correlation of our data.
Line of Best Fit Equation: Difference in length of spring (cm) = 0.1375 (cm/g) * Mass (g) - 0.3597 (cm)
The y-intercept in our graph, which also happens to be our x-intercept, represents the amount of mass added to the spring when the spring did not stretch at all (0g).
Line of Best Fit Equation: Difference in length of spring (cm) = 0.1375 (cm/g) * Mass (g) - 0.3597 (cm)
The y-intercept in our graph, which also happens to be our x-intercept, represents the amount of mass added to the spring when the spring did not stretch at all (0g).
Conclusion:
During this experiment we were testing the relationship between mass and the amount a spring was stretched. According to our data we were able to see a clear linear correlation between our two variables. Because of this correlation, we know that the amount of mass added to a spring is proportional to the amount the spring is stretched. Using the small amount of error that could have been caused by an incorrect measurement, we see from our graph that all of our ten data points lie on our line of best fit. Although, we were not able to experiment past 800g, we can be fairly confident that the relationship will still hold true if the same experiment is tested with a higher range.
Evaluation Procedures:
One main limitation that was noticed during the experiment was the maximum amount of weight that was able to be added to the spring. Because of this limitation we were not able to be fully confident about our results. Our equipment was also not the most accurate as possible; the yardstick that was used was at times hard to take precise measurements with and could have therefore skewed our results slightly. Lastly, our reaction time did not play a huge part in the experiment, but could have slightly affected the difference in spring length, due to other factors such as surrounding air pressure exerting other force onto our spring.
Improving the Investigation:
To improve the investigation, having a higher stand to measure an increased amount of mass would help find a more exact correlation and equation. For the best case scenario, performing the experiment in an air-tight area where there are no other factors that can exert force and pressure on our spring and add or subtract the amount of difference between lengths.
