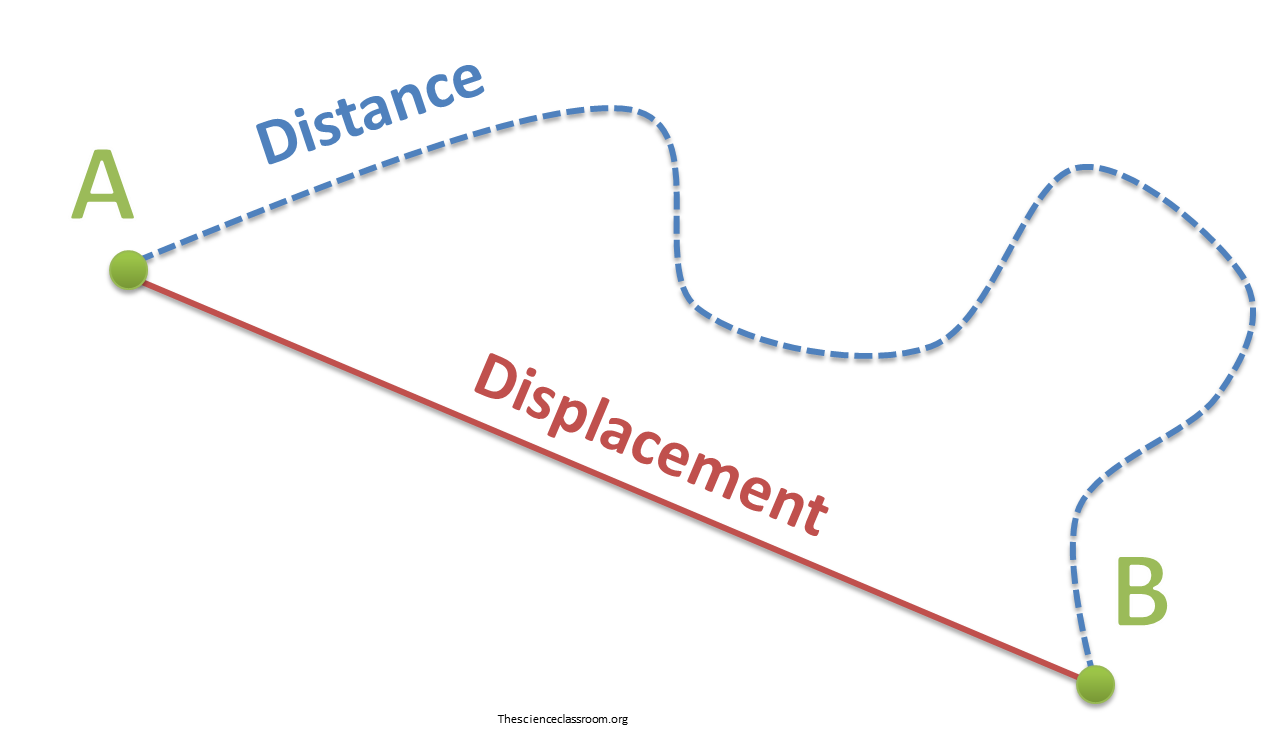
Position, Distance, and Displacement:
Position - An object's distance and direction from a point
Distance - How much an object has moved from one point to another
Displacement - Difference between the initial and final positions of an object
Position - An object's distance and direction from a point
Distance - How much an object has moved from one point to another
Displacement - Difference between the initial and final positions of an object
Position-Time and Velocity-Time Graphs:
Position-Time - x axis has time, y axis has position, usually represents an object moving
Velocity-Time - x axis has time, y axis has velocity, graph represents the slope of the position-time graph at different points
Position-Time Graph:
Position-Time - x axis has time, y axis has position, usually represents an object moving
Velocity-Time - x axis has time, y axis has velocity, graph represents the slope of the position-time graph at different points
Position-Time Graph:
Slope is positive |
Slope is negative |
Slope gets steeper |
Slope gets shallower |
Moves uphill |
Moves downhill |
Moves away from detector |
Moves toward detector |
Speeds up |
Slows down |
|
Slope is positive |
X |
X |
||||||||
Slope is negative |
X |
X |
||||||||
Slope gets steeper |
X |
X |
X |
|||||||
Slope gets shallower |
X |
X |
X |
Determining Average and Instantaneous Velocity:
Average velocity = (change in position)/(change in time)
Average velocity = (change in position)/(change in time)
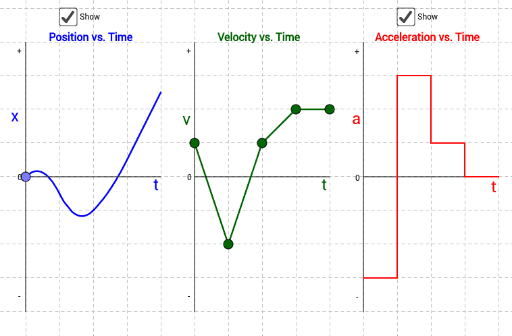
Acceleration-Time Graphs
Slope graph of velocity is the same as acceleration
Using a velocity-time graph, we can graph out what a rough acceleration-time graph will look like by matching up slopes by interval
Slope graph of velocity is the same as acceleration
Using a velocity-time graph, we can graph out what a rough acceleration-time graph will look like by matching up slopes by interval
|
|
