Question: What is the relationship between the position of a cart and the time it is running on a ramp?
Independent Variable: Time (seconds)
Dependent Variable: Position (centimeters)
Control Variables: Type of cart, angle of ramp, starting height
Collection Method:
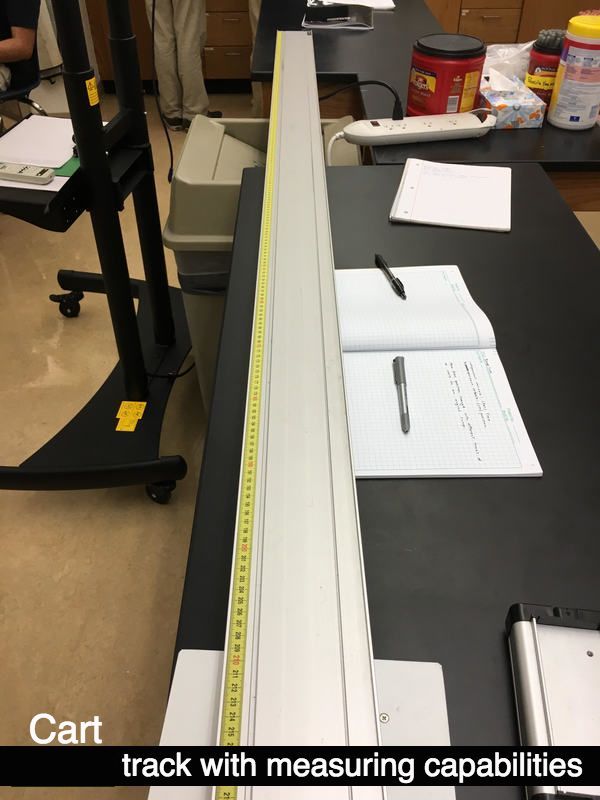
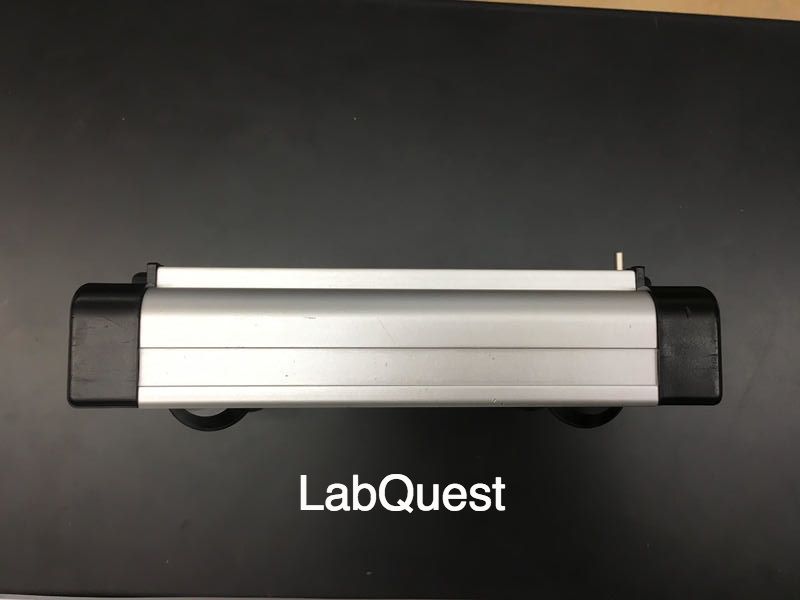
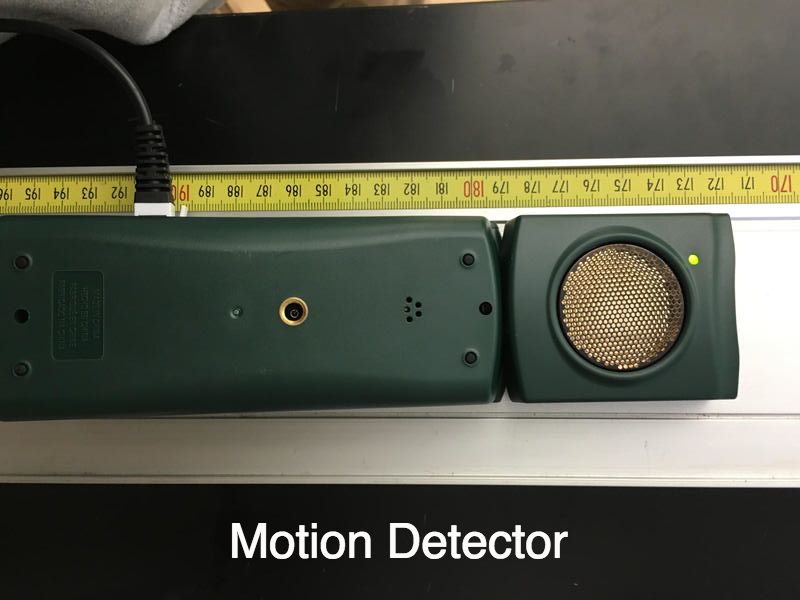
In order to determine the position of the cart at a certain time, we have to start our cart at a specific initial point and let it run until the time interval is up. In order to provide us with a substantial amount of data we used two different methods of data collection, a motion detector and video analysis. In addition to these collection devices, we will be using a large metal meter stick that measures up to approximately 230 centimeters and a labquest to store and transfer data. Once we have collected all the necessary materials, we will place our cart at an initial position starting from the front of the front wheel; this point will act as our y-intercept for our data. After this, we will use our different methods of time recording to test the position over different intervals.
Independent Variable: Time (seconds)
Dependent Variable: Position (centimeters)
Control Variables: Type of cart, angle of ramp, starting height
Collection Method:
In order to determine the position of the cart at a certain time, we have to start our cart at a specific initial point and let it run until the time interval is up. In order to provide us with a substantial amount of data we used two different methods of data collection, a motion detector and video analysis. In addition to these collection devices, we will be using a large metal meter stick that measures up to approximately 230 centimeters and a labquest to store and transfer data. Once we have collected all the necessary materials, we will place our cart at an initial position starting from the front of the front wheel; this point will act as our y-intercept for our data. After this, we will use our different methods of time recording to test the position over different intervals.
|
Procedures:
|
|
|
Setup:
The video on the right shows the way the experiment was set up. This specific video highlights the video analysis trial of the experiment, but for the motion detector trial we had a motion detector added to the right side of the beam. |
|
Recorded/Processed Data:
Since both sets of data were recorded on LoggerPro, these two sections were combined into one and will be presented with graphs to show the data, because there were too many single points to consolidate into a data table.
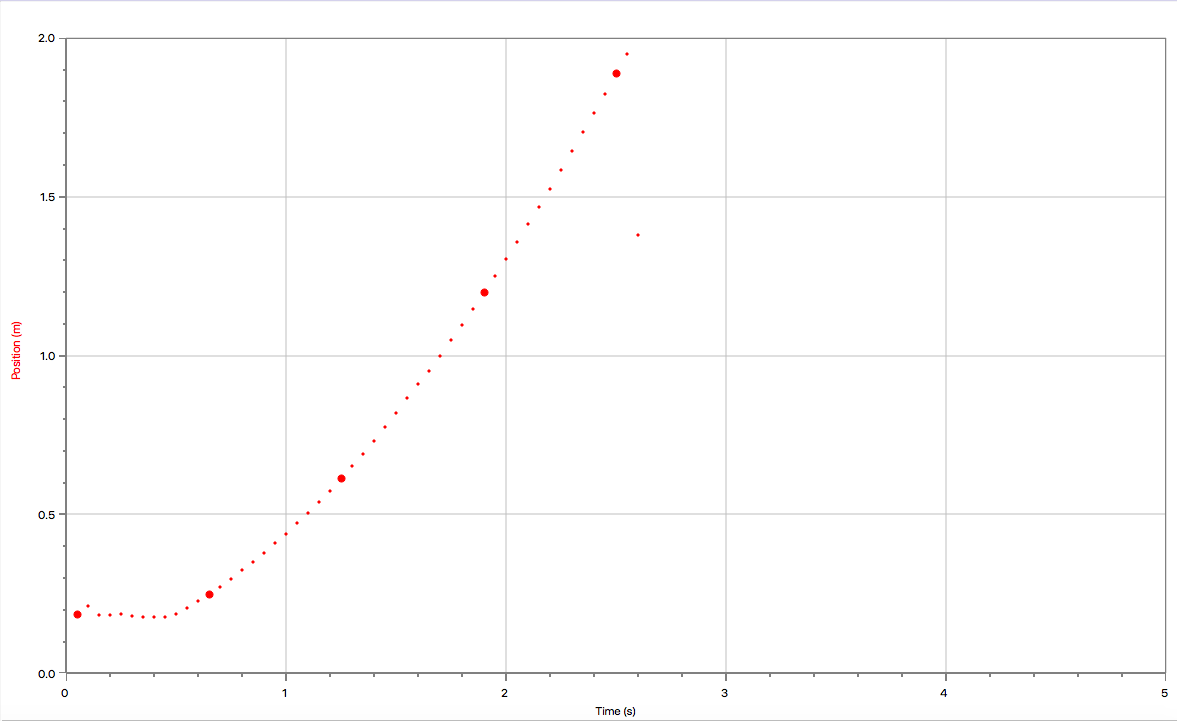
The following graph represents the relationship between time (seconds) and position (meters) using a motion detector.
Since both sets of data were recorded on LoggerPro, these two sections were combined into one and will be presented with graphs to show the data, because there were too many single points to consolidate into a data table.
The following graph represents the relationship between time (seconds) and position (meters) using a motion detector.
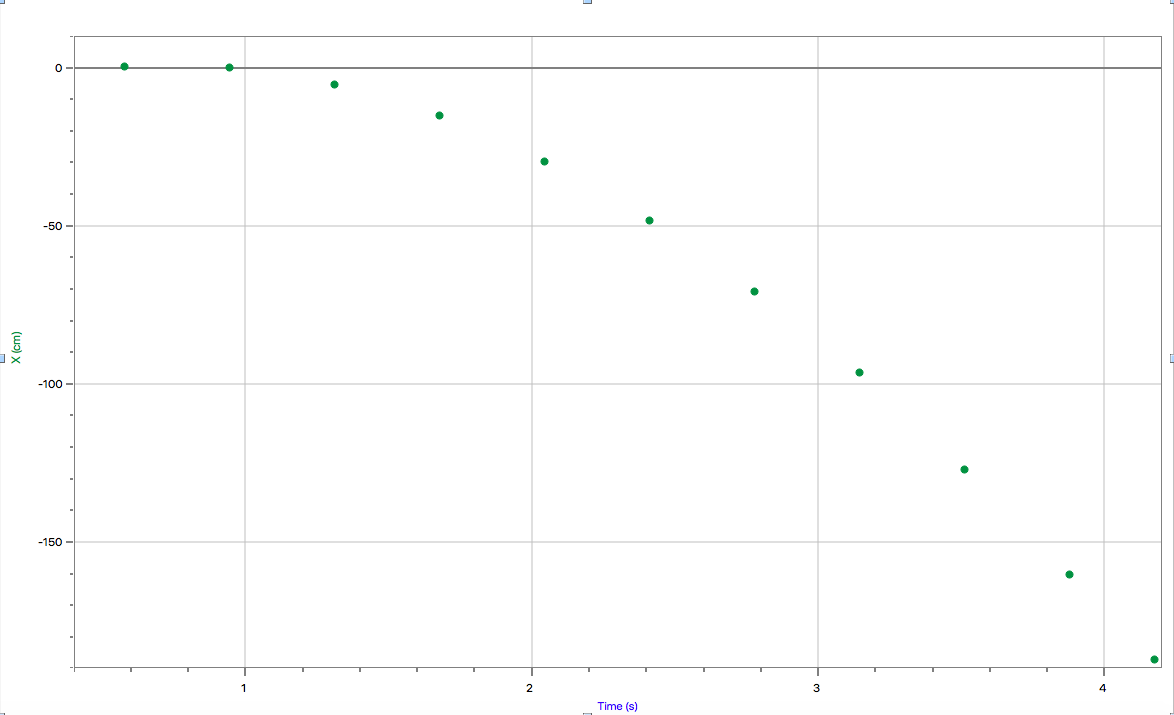
The following graph represents the relationship between time (seconds) and position (centimeters) using video analysis. The graph displayed is different from the above because the position is from the start of the meter stick to the end, going away, making the values decrease from 0.
The following graph is the velocity-time graph of the video analysis trial, and represents the relationship between time (sec) and velocity (m/s). Once again, the velocity values are decreasing from 0 because of the position the start and end places are on the meter stick.
Presentation of Processed Data:
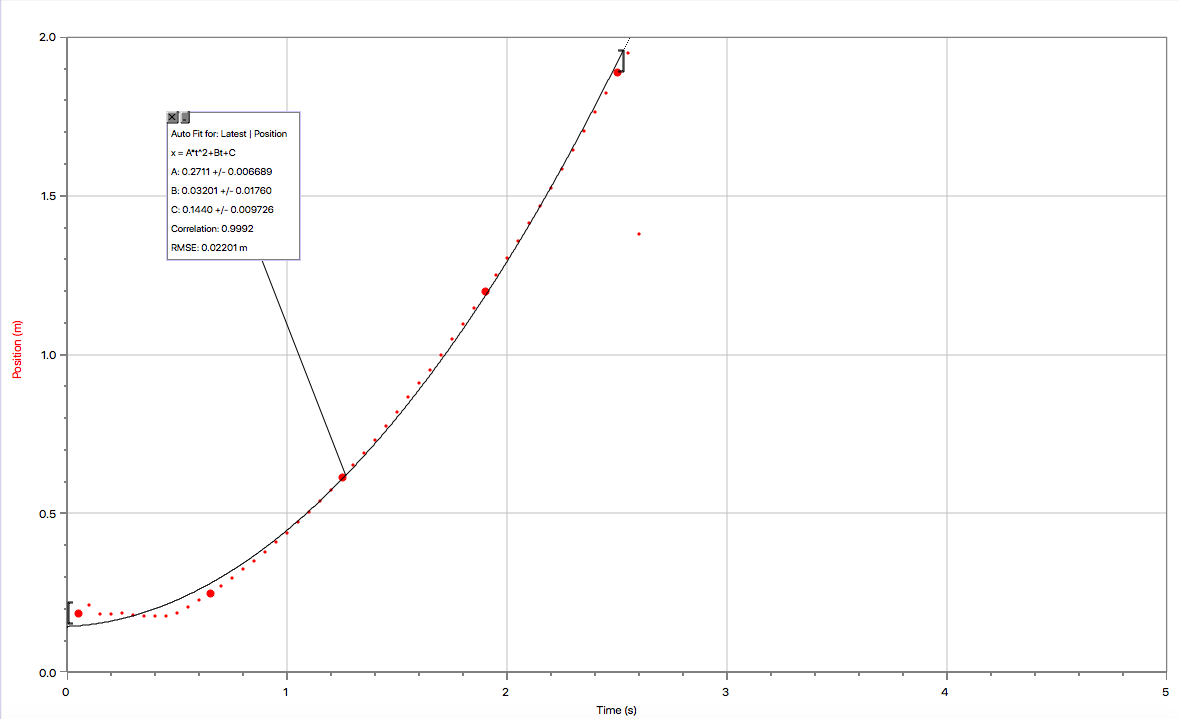
The following graph represents the relationship between time (seconds) and position (meters) using a motion detector. The line of best fit has been converted to centimeters for easier comparison between other graphs and data.
Line of Best Fit Equation: 27.11*t^2 (seconds^2) + 3.201*t (seconds) + 14.40 (centimeters)
The y-intercept of our graph is approximately 0.1440, which represents the starting position of the cart at time 0.
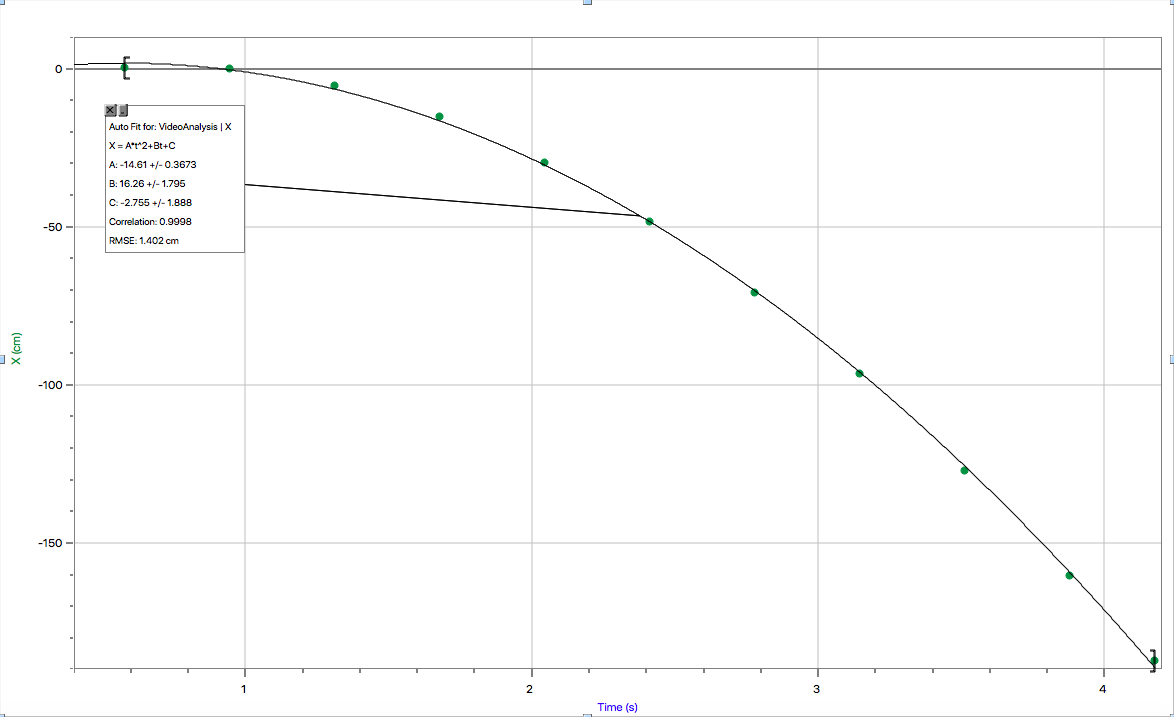
The following graph represents the relationship between time (seconds) and position (centimeters) using video analysis. Just like the previous video analysis graph, the position is from the start of the meter stick to the end, going away, making the values decrease from 0.
Line of Best Fit Equation: -14.61*t^2 (seconds^2) + 16.26*t (seconds) - 2.755(centimeters)
The y-intercept of our graph is approximately 0.02755, which represents the starting position of the cart at time 0.
Line of Best Fit Equation: -14.61*t^2 (seconds^2) + 16.26*t (seconds) - 2.755(centimeters)
The y-intercept of our graph is approximately 0.02755, which represents the starting position of the cart at time 0.
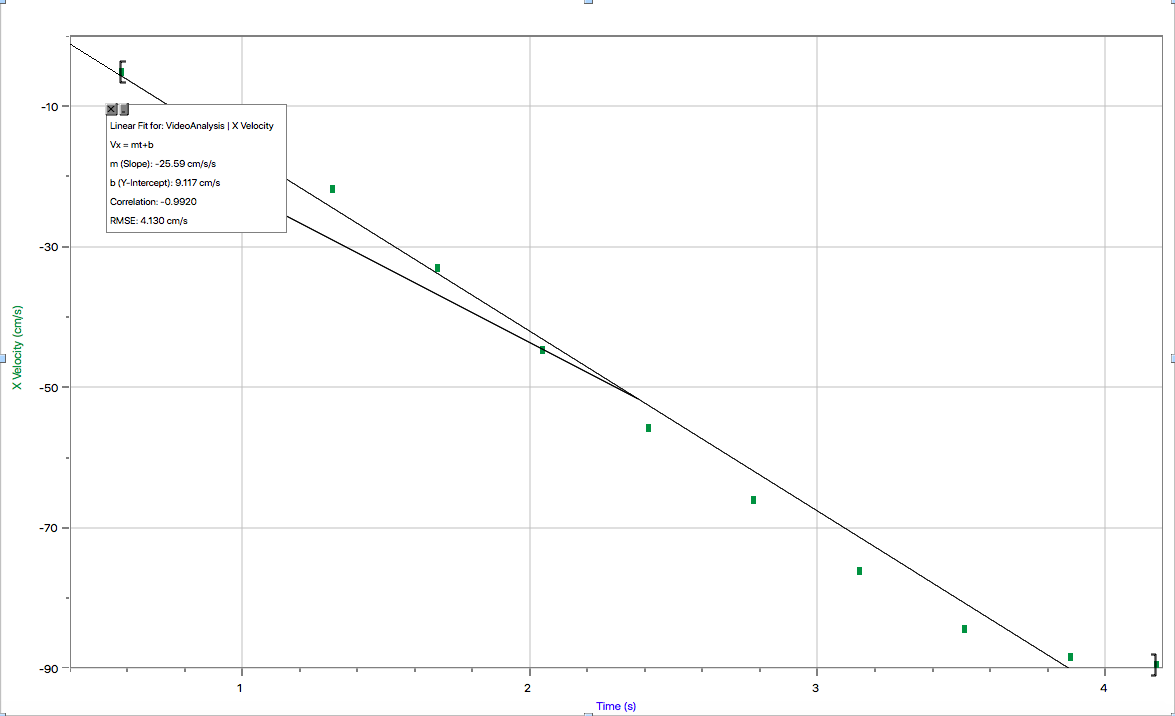
The following graph represents the relationship between time (seconds) and velocity (centimeters/second) using video analysis. Just like the previous video analysis graph, the position is from the start of the meter stick to the end, going away, making the values decrease from 0.
Line of Best Fit Equation: -25.59(cm/s^2) + 9.117 (centimeters)
The y-intercept of our graph is approximately 9.117, which represents the starting velocity of the cart at time 0.
Line of Best Fit Equation: -25.59(cm/s^2) + 9.117 (centimeters)
The y-intercept of our graph is approximately 9.117, which represents the starting velocity of the cart at time 0.
Conclusion:
Throughout both trials we were testing the relationship between time (seconds) and position (centimeters/meters). According to our data we can see a basic quadratic correlation between our two variables, although our last set of data may have been negative, if the video analysis had been flipped we would have also gotten a positive quadratic correlation between our two variables. Because of this correlation we know that the more time that passes is quadratically proportional to the position of the cart. Although we had slight uncertainty in our measurements, we are still confidently able to determine a basic quadratic relationship between our two variables.
Evaluation Procedures:
During both the motion detector and video analysis trials we saw little uncertainty due to a program and computer doing much of the analysis and data collecting for us. However, there were obviously still some flaws with data collection varying from initial position affecting initial velocity, to the exact angle of the ramp changing between trials. Overall however, our procedures were able to answer the question thoroughly.
Improving the Investigation:
Technically speaking there are no improvements that need to be made to the investigation. Our equipment and data processing was all digitized meaning there theoretically should be little error in our results, and our equations will be the same in both trials. However, by looking at our graphs and data, we notice that is not true. A main reason for this could be and angle the video analysis was taken at or the position the motion detector was placed at. Overall however, our investigation does not need much improvement and under the right circumstances will produce precise and accurate results.
